How to monitor HTTP requests and responses using TCP/IP Monitor in Eclipse
- Details
- Written by Nam Ha Minh
- Last Updated on 07 August 2019 | Print Email
 For example, suppose that we need to monitor the HTTP communications of a web application running on localhost (typically under a Tomcat instance inside Eclipse), which would be normally accessed via this URL:
http://localhost:8080/FileUploadSpringMVC
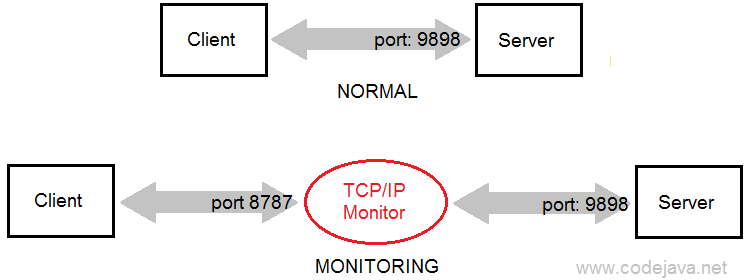
And the TCP/IP Monitor is listening on the port number 9898, therefore we have to replace the port 8080 by 9898 as follows:http://localhost:9898/FileUploadSpringMVC
If the monitor is running on the port 9898, it will receive the requests and forward them to the destination server at the port configured (8080).Now, let’s go through the steps in details. Suppose that we want to monitor a web application developed in the tutorial: Spring MVC File Upload Tutorial with Eclipse IDE. The application is deployed on Tomcat server which is listening on the port number 8080.Set up a TCP/IP Monitor in Eclipse:
Open the TCP/IP Monitor settings by go to the menu Window > Preferences > TCP/IP Monitor: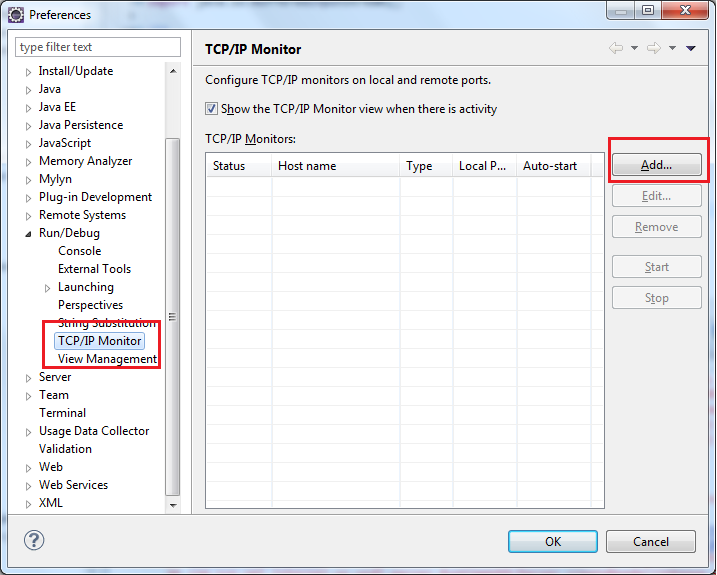 Click Add to create a new monitor. In the New Monitor dialog, enter the following information:
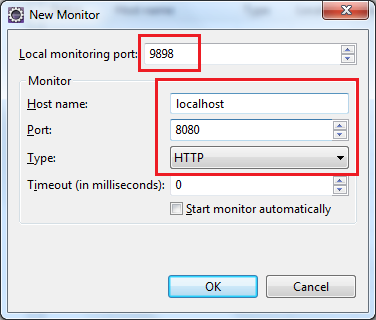
- Local monitoring port: 9898
- Host name: localhost
- Port: 8080
- Type: HTTP
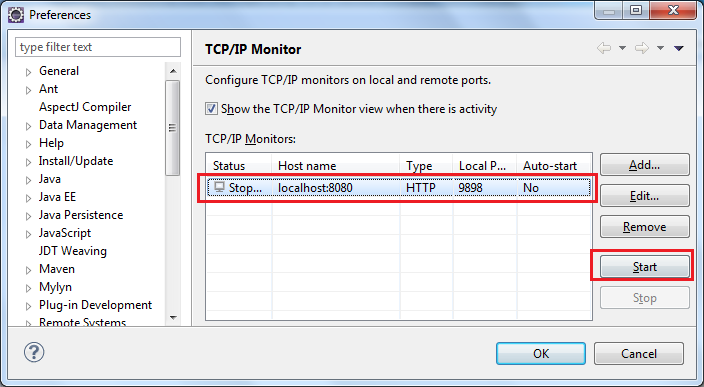 When the Status changed to Started, click OK to close the Preferences dialog. Next, click Window > Show View > Other… > TCP/IP Monitor> OK to open up the TCP/IP Monitor view:
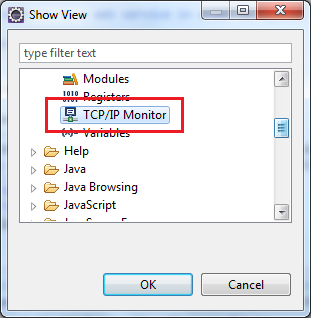 The TCP/IP Monitor view is added to the workspace but there is no information because no communication happens:
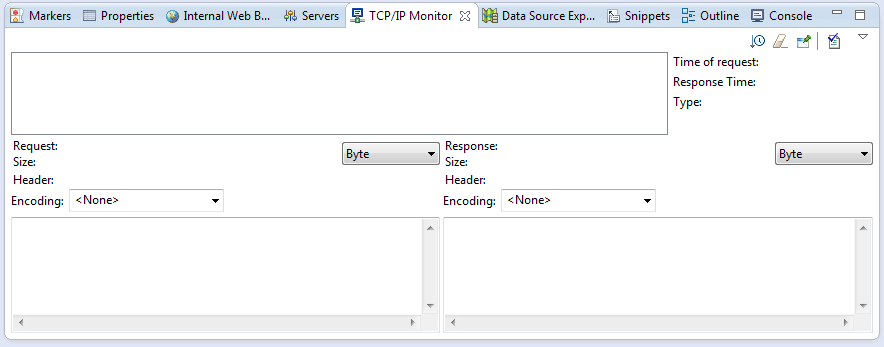 Now, make sure that the FileUploadSpringMVC application is up and running; open an Internal Web Browser (or an external browser) and type the following URL:
http://localhost:9898/FileUploadSpringMVC
The monitor immediately displays the request and response information as shown in the following screenshot: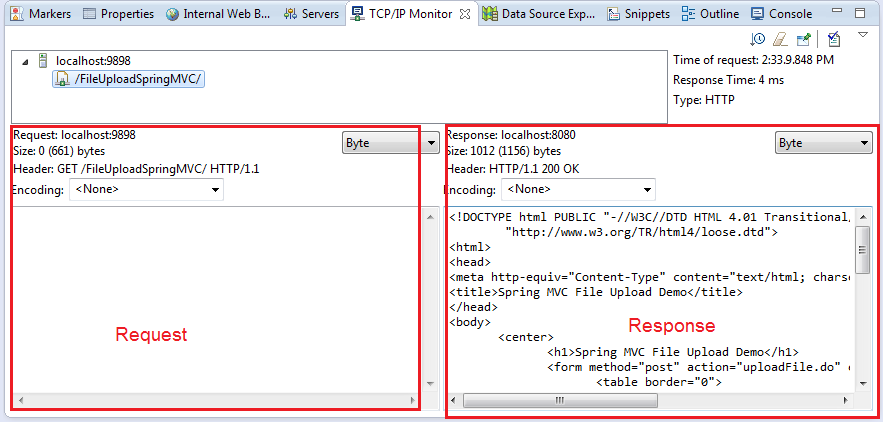 Now, go back to the browser and try to enter some information and upload two files:
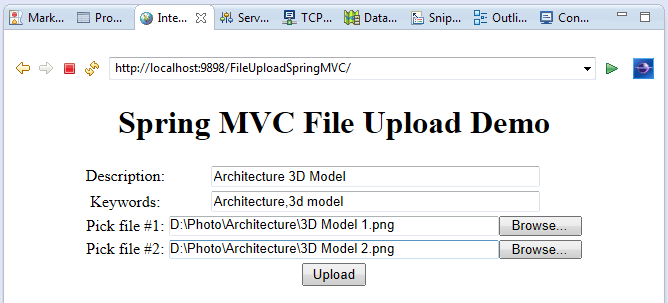 The monitor captures the POST request and HTML response immediately:
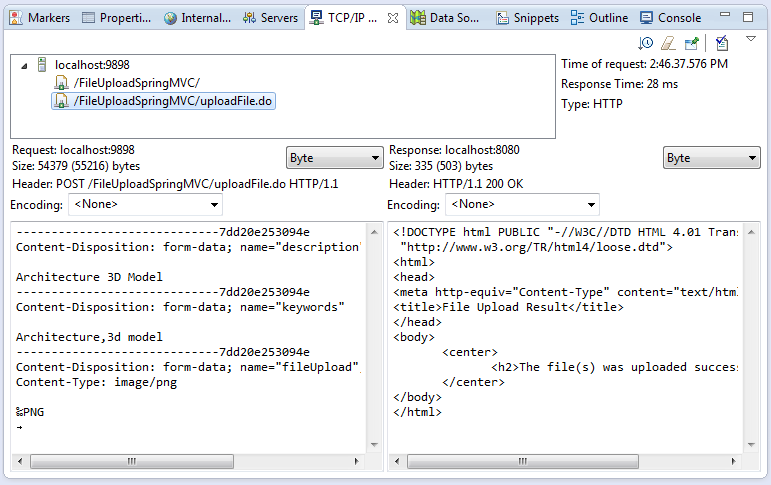 That’s really useful if we want to analyze the raw request and response! In addition, the TCP/IP monitor allows us to modify and resend the request, as well as watch the request/response in different types and encodings. Let experience the monitor further yourself! To stop the monitor, go to the TCP/IP Monitor settings in the Preferences dialog (or right click inside the TCP/IP Monitor view and select Properties). Then select the monitor you want to stop, and click Stop:
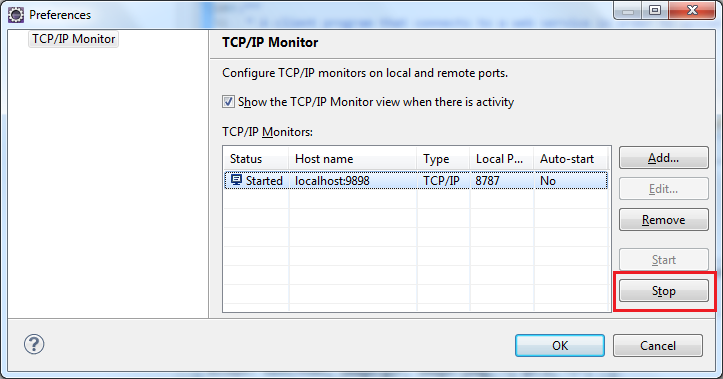 Remember to change the port in the URL back to the regular number (8080) when the monitor is stopped.
 Monitor hosts other than localhost:
Is it possible to monitor the communications between the web browser and sites other then the localhost? Oh, certainly! Here’s an example of the settings that are used to monitor the site www.bing.com: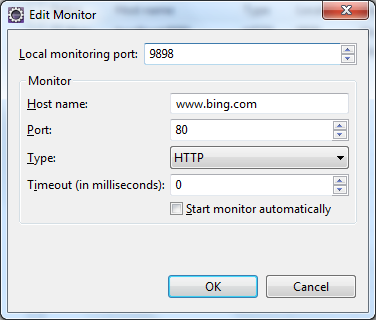 Now, go to the browser and type the URL as http://localhost:9898, you will see the Bing’s home page! The request and response are captured by the monitor as shown in the following screenshot:
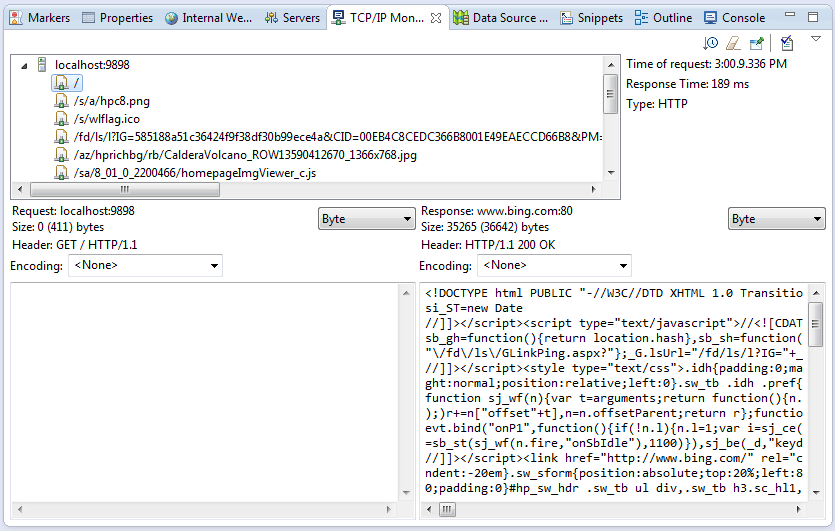
Related Tutorials:
Other Eclipse Tutorials:
- How to import existing projects into Eclipse workspace
- How to use Eclipse IDE for Java EE Developers
- How to create, build and run a Java Hello World program with Eclipse
- How to create, deploy and run Java Servlet in Eclipse
- How to generate JAR file in Eclipse
- How to create WAR file for Java web application in Eclipse
- How to create Ant build file for existing Java project in Eclipse
- How to generate Javadoc in Eclipse
- How to create Java web project with Maven in Eclipse
- 25 Eclipse Shortcut Keys for Code Editing
- How to Add Copyright License Header for Java Source Files in Eclipse
About the Author:
 Nam Ha Minh is certified Java programmer (SCJP and SCWCD). He began programming with Java back in the days of Java 1.4 and has been passionate about it ever since. You can connect with him on Facebook and watch his Java videos on YouTube.
Comments